Performance profiles
Performance profiles are a practical way to have a global overview of a set of algorithms’ performances. On the \(x\) axis, we have the relative gap (%), and on the \(y\) axis, the percentage of data sets solved within the gap. So for example, at the intersection with the \(y\) axis is the percentage of data sets solved optimally, and at the intersection with \(y=100\%\) is the relative gap within which all data sets are solved.
At a glance, the more the curve is in the upper left corner, the better the algorithm.
We compare the performances of vrpy and OR-Tools (default options):
Results are found here [link to repo] and can be replicated.
CVRP
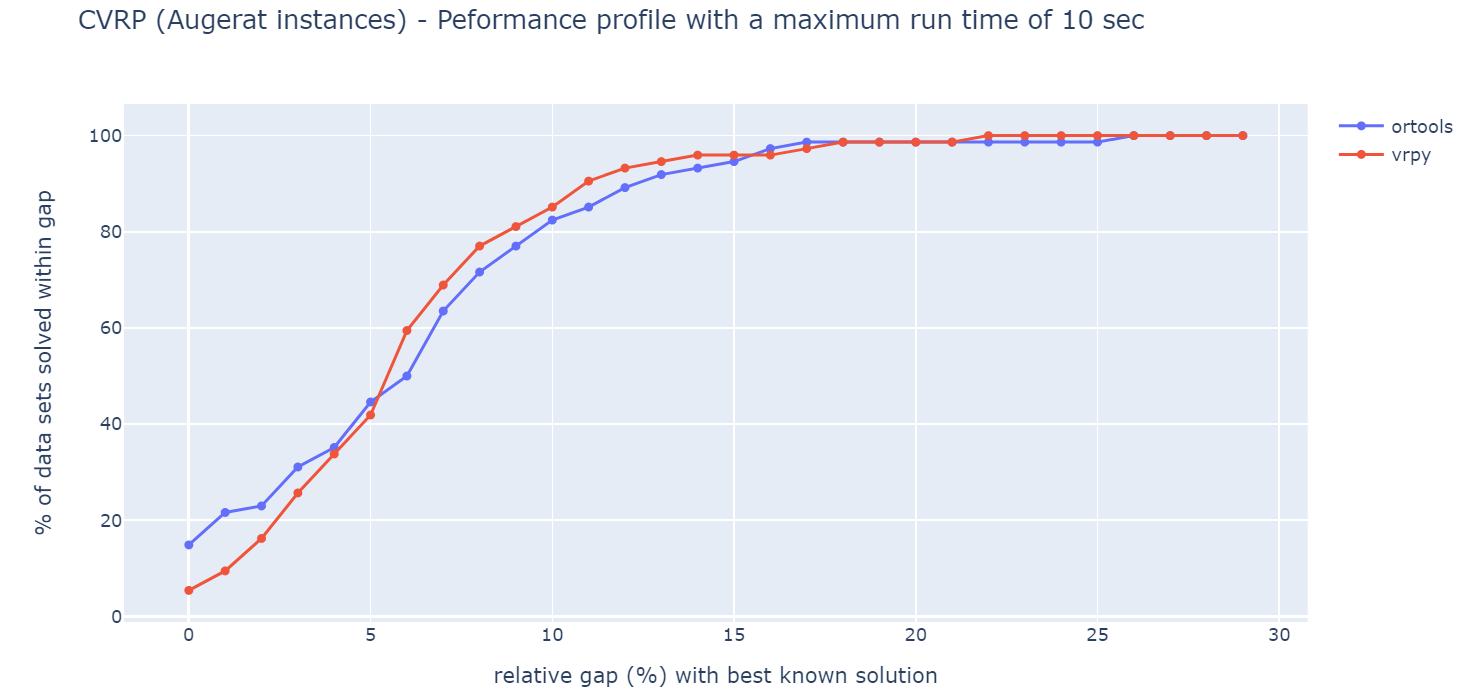
We can see that with a maximum running time of \(10\) seconds, OR-Tools solves \(15\%\) of the instances optimally, while vrpy only solves \(5\%\) of them. Both solve approximately \(43\%\) of instances with a maximum relative gap of \(5\%\). And both solve all instances within a maximum gap of \(25\%\).
CVRPTW
Coming soon.